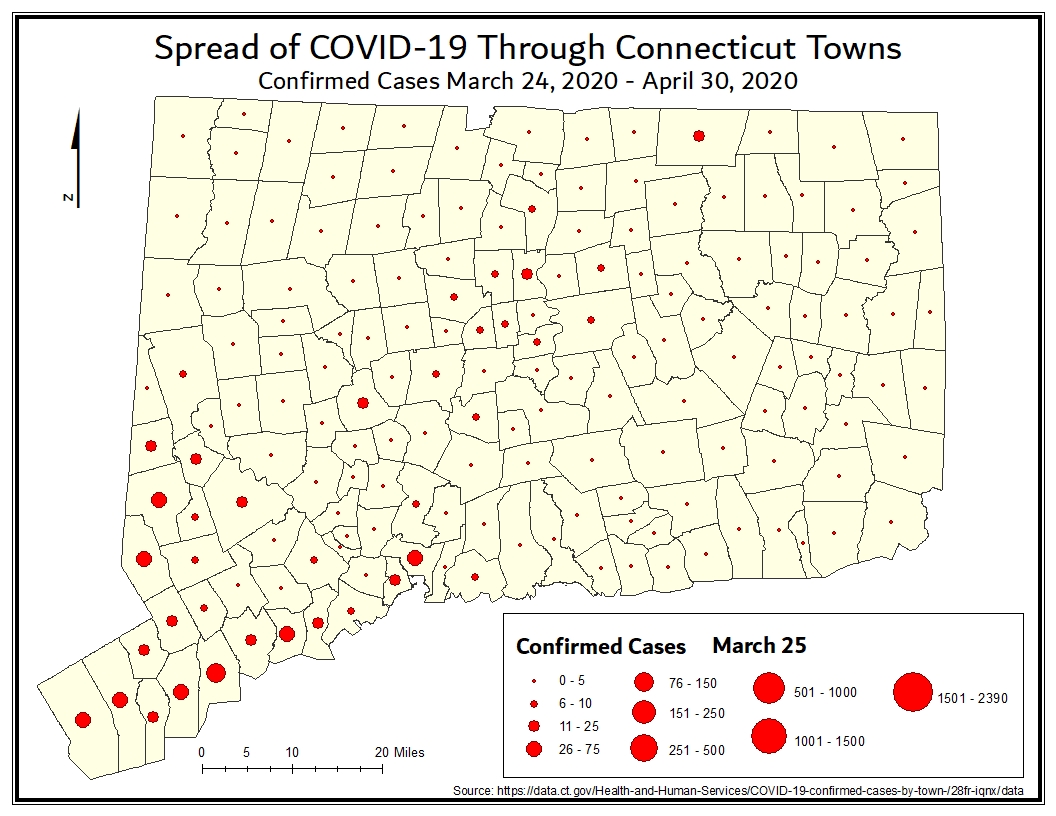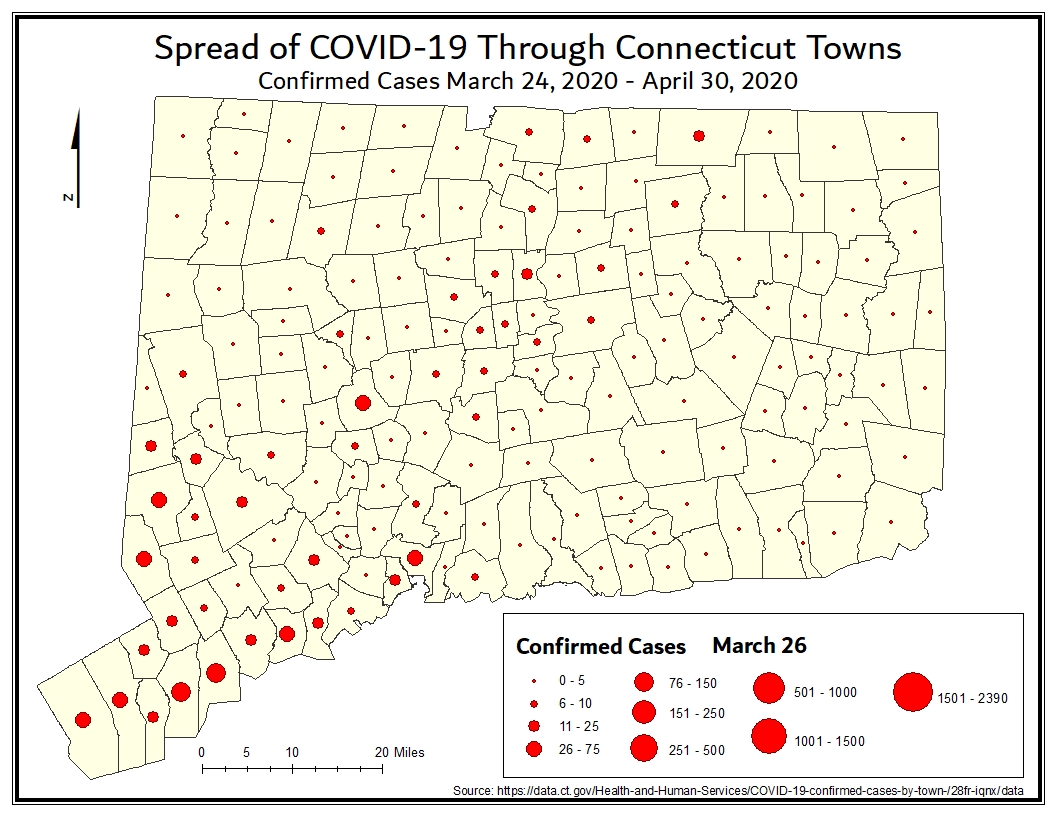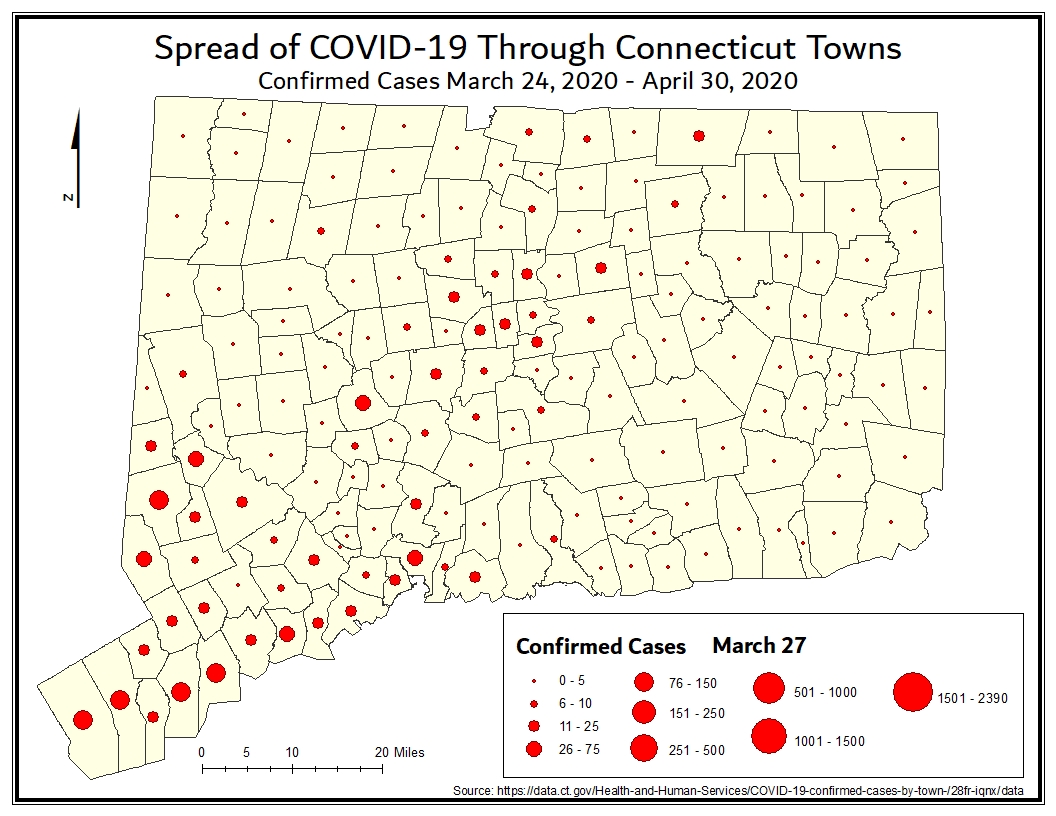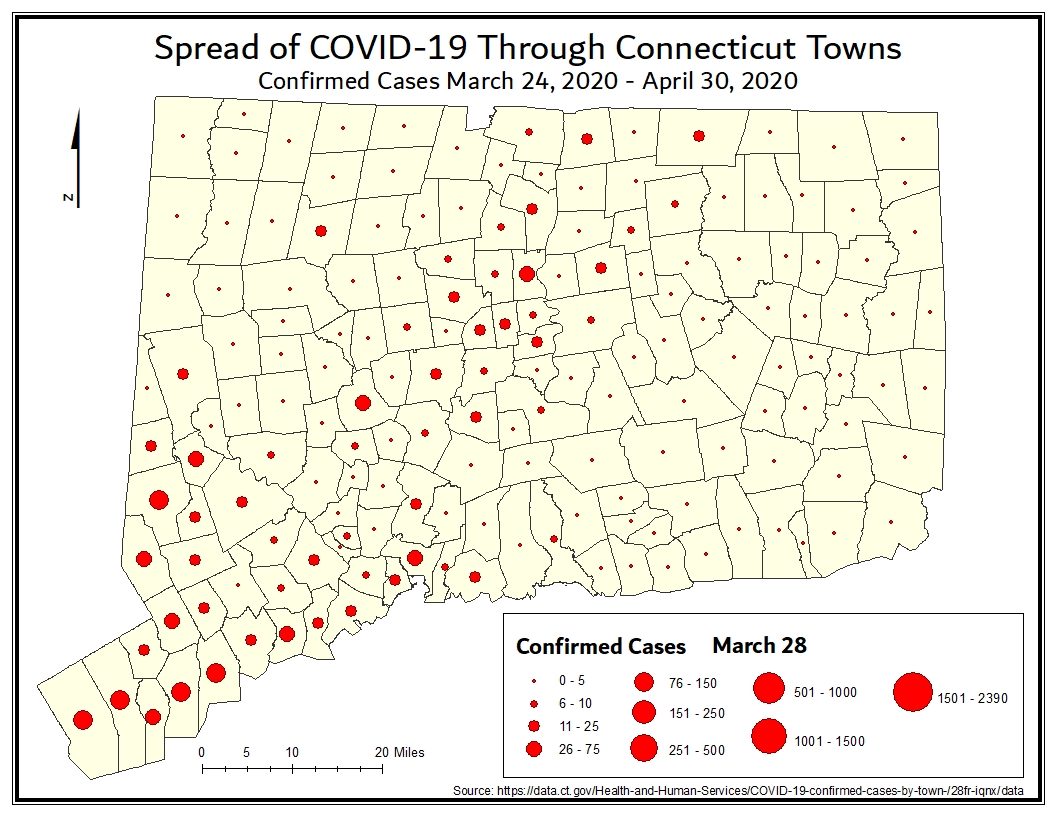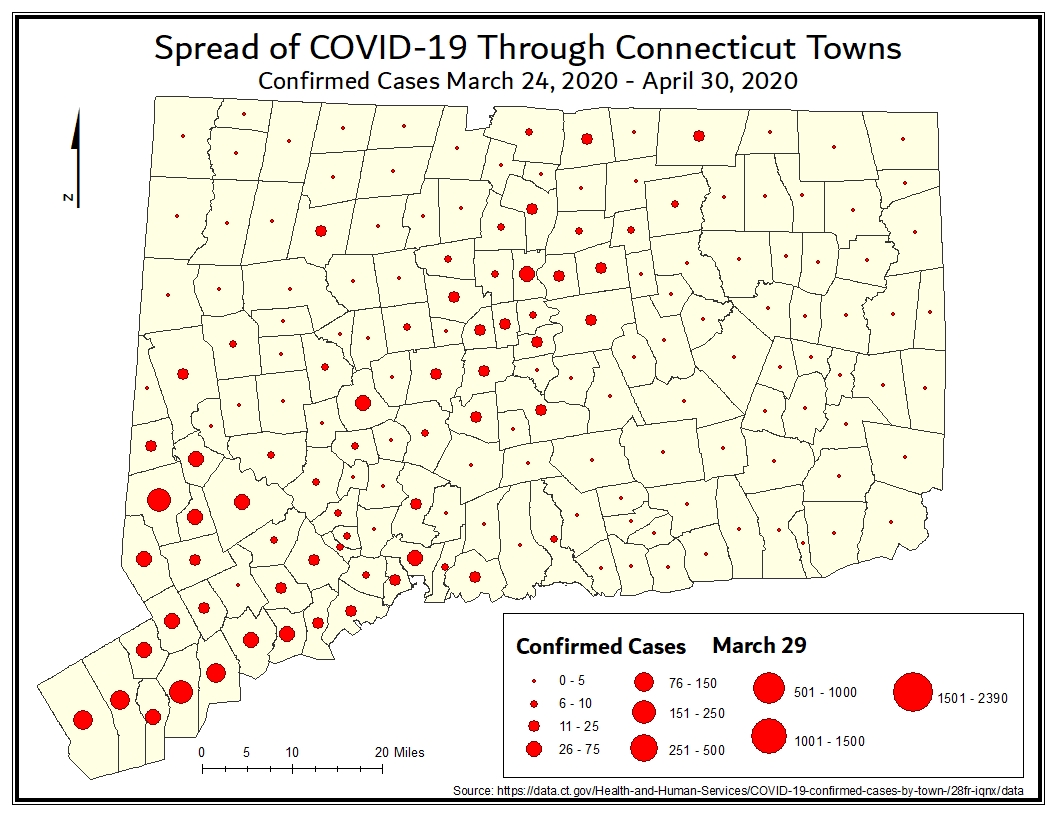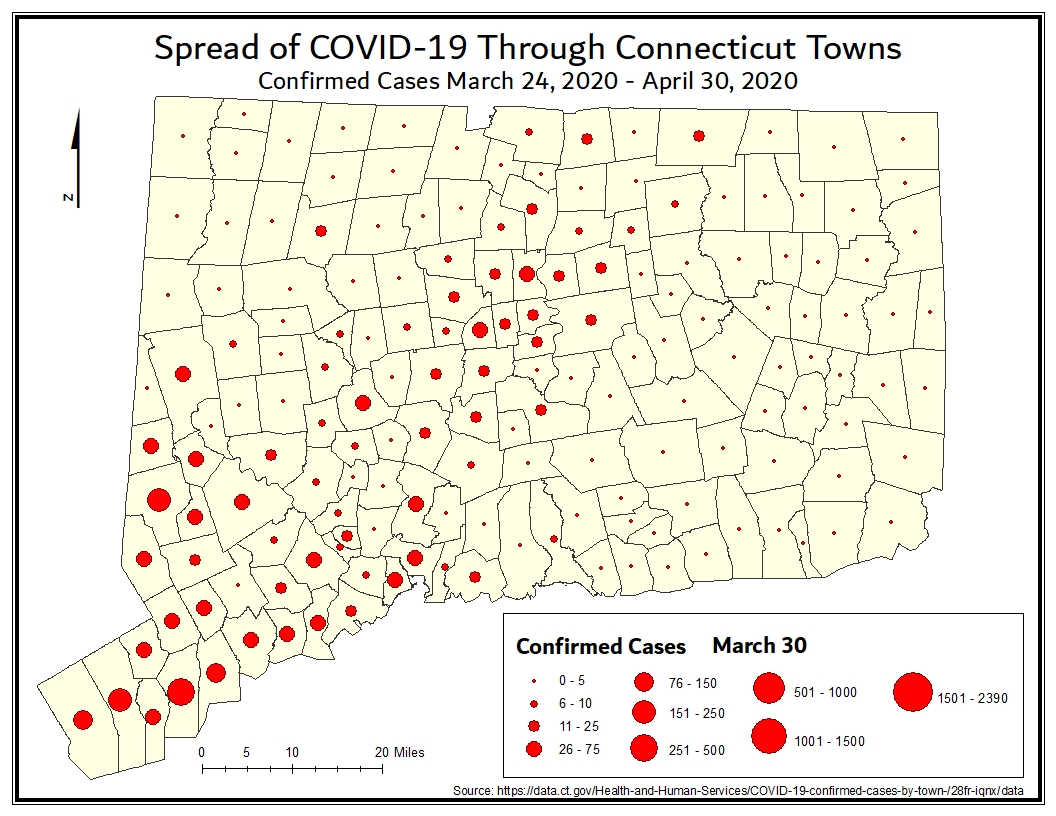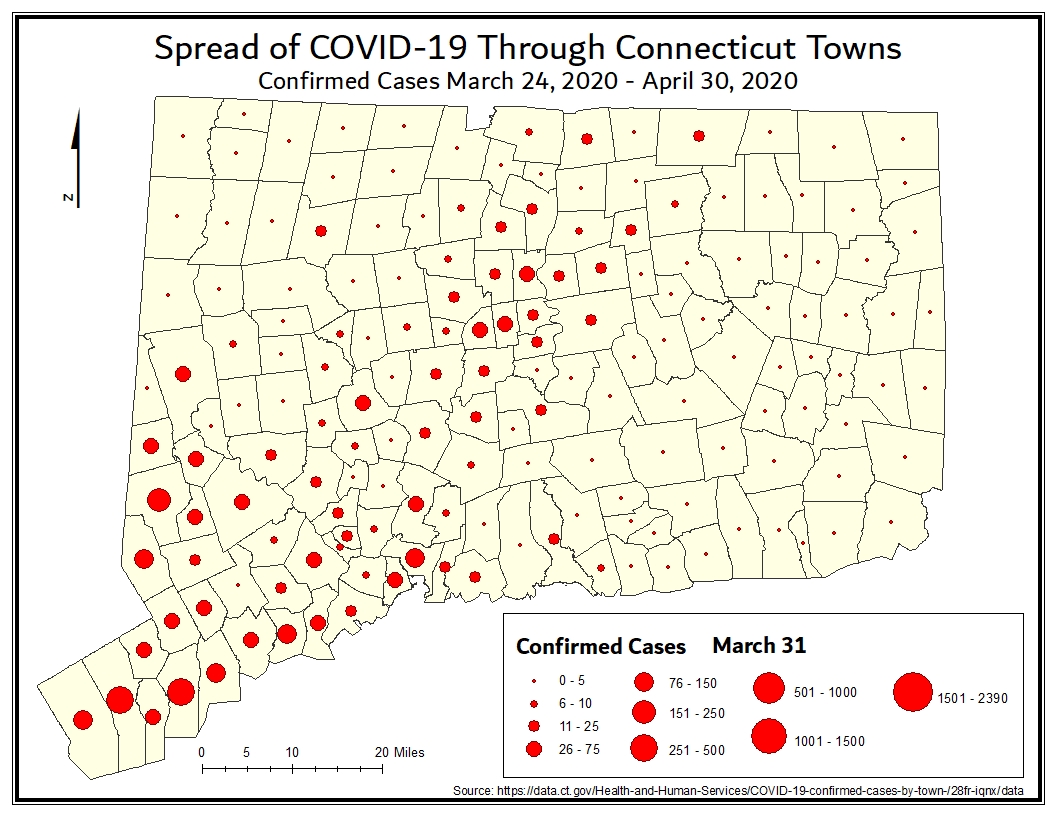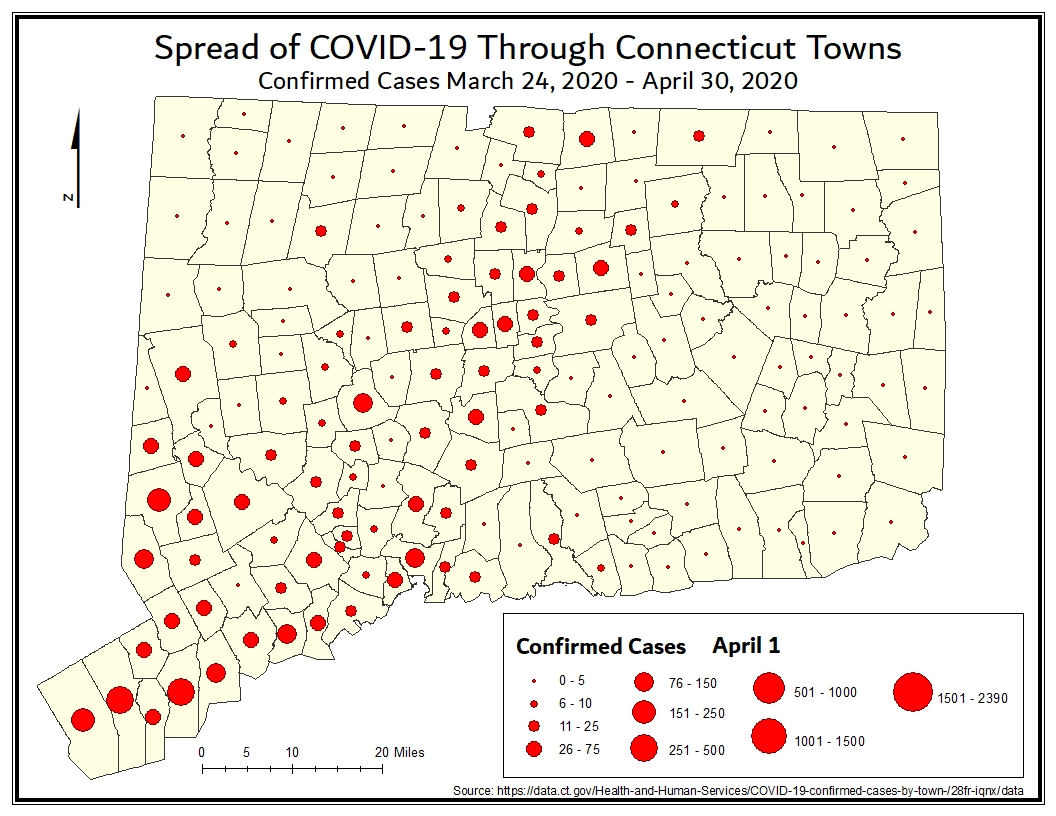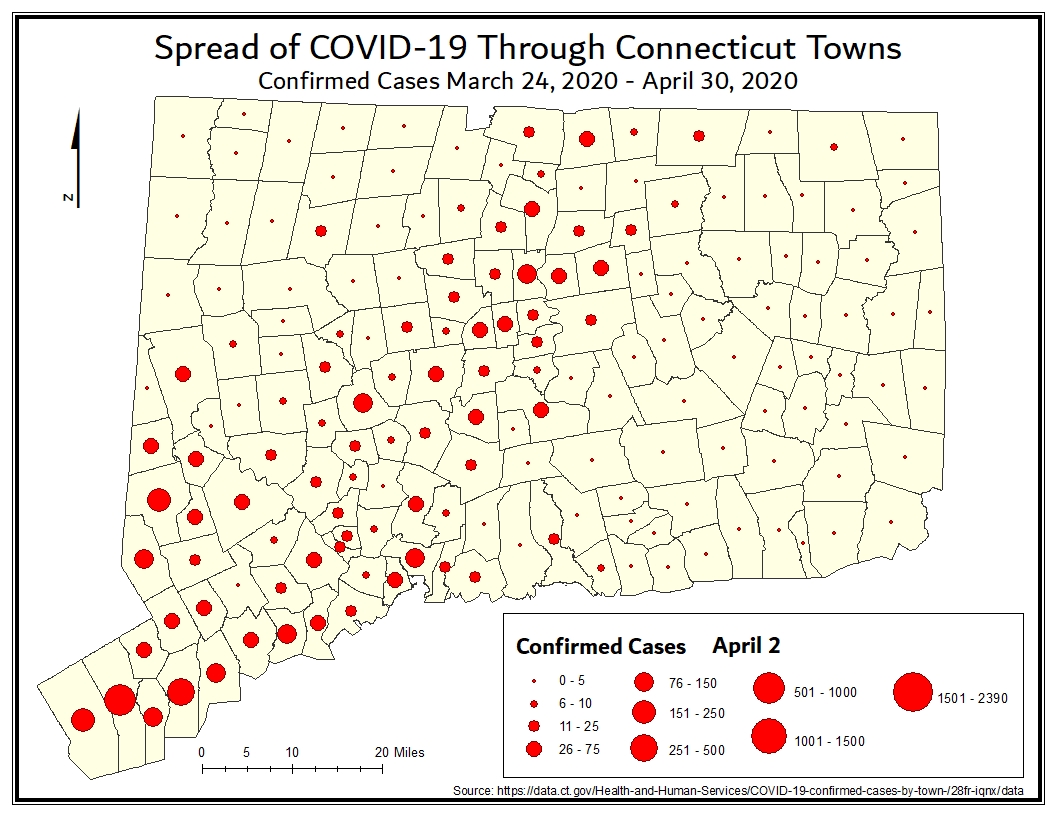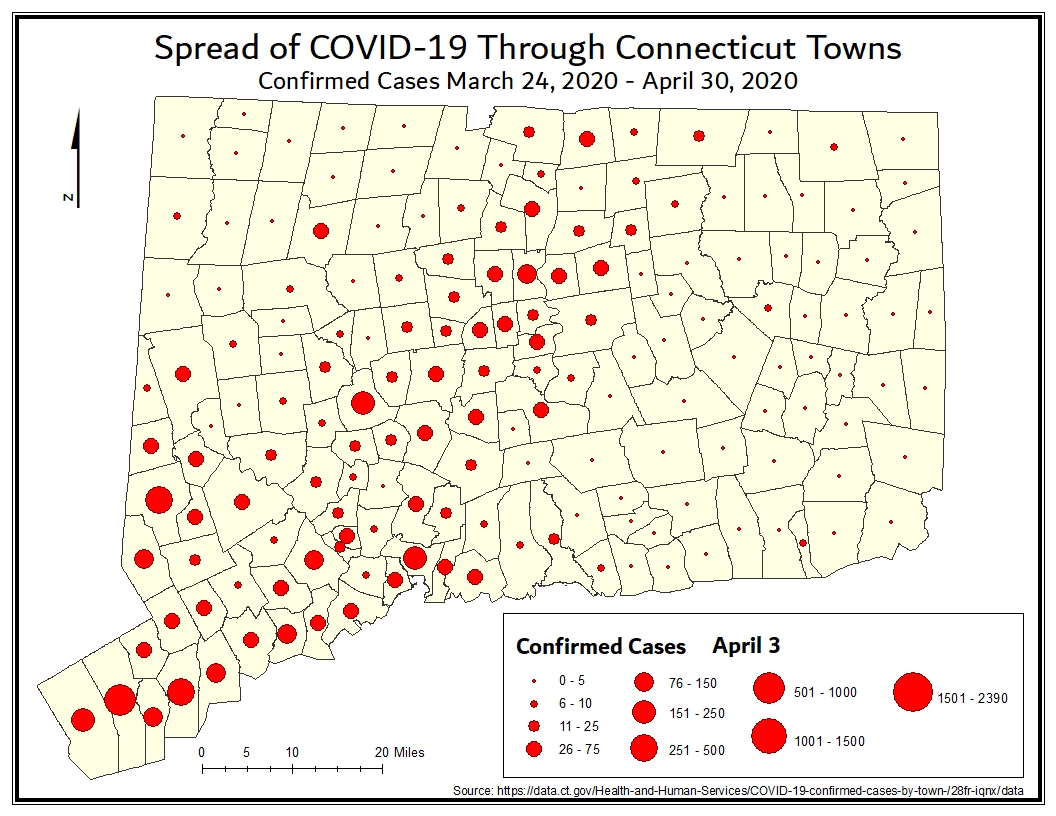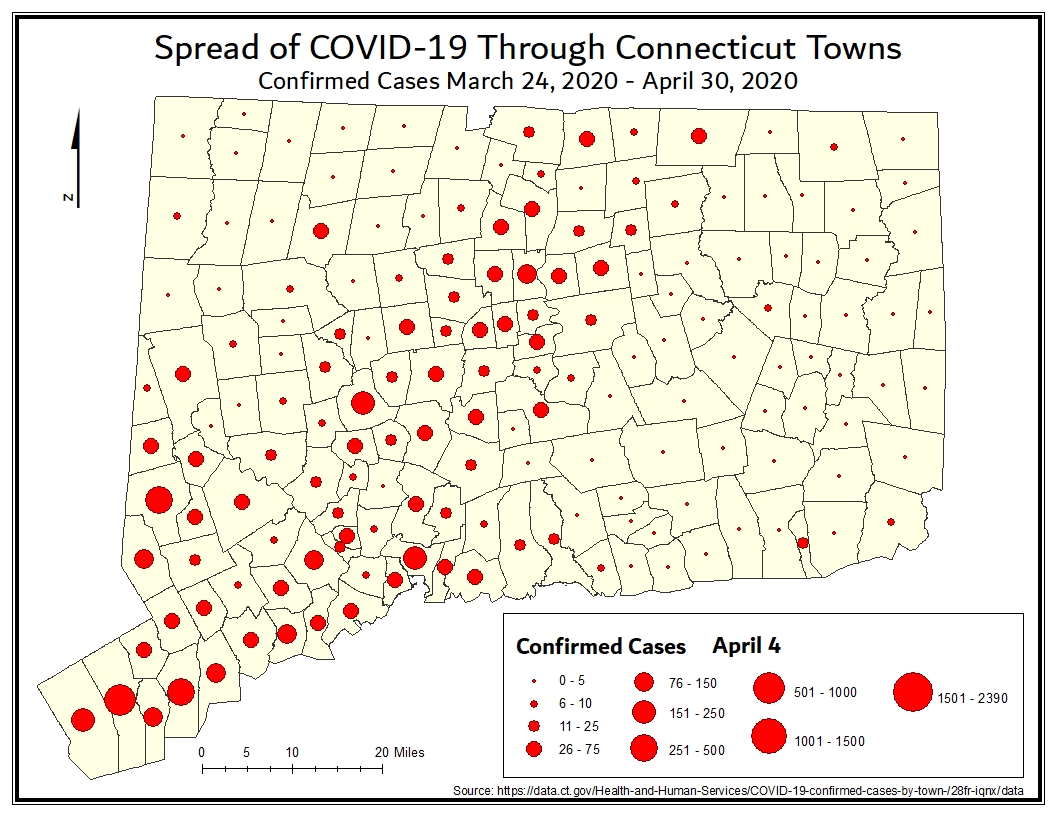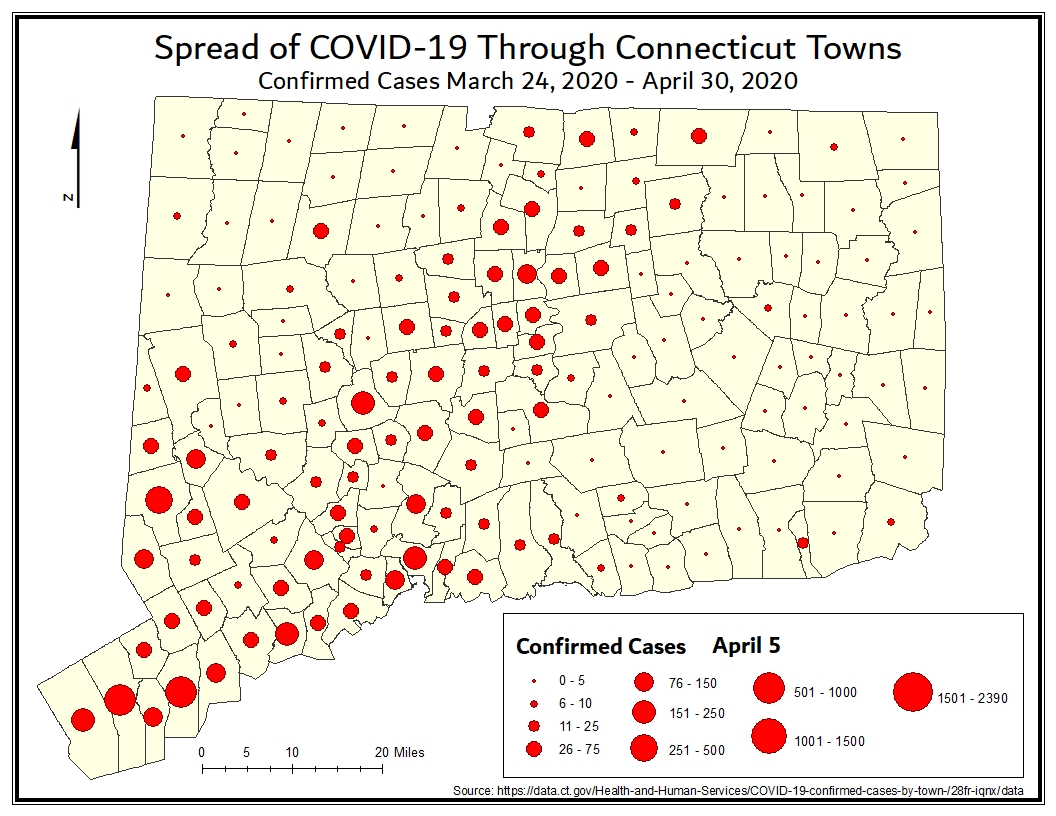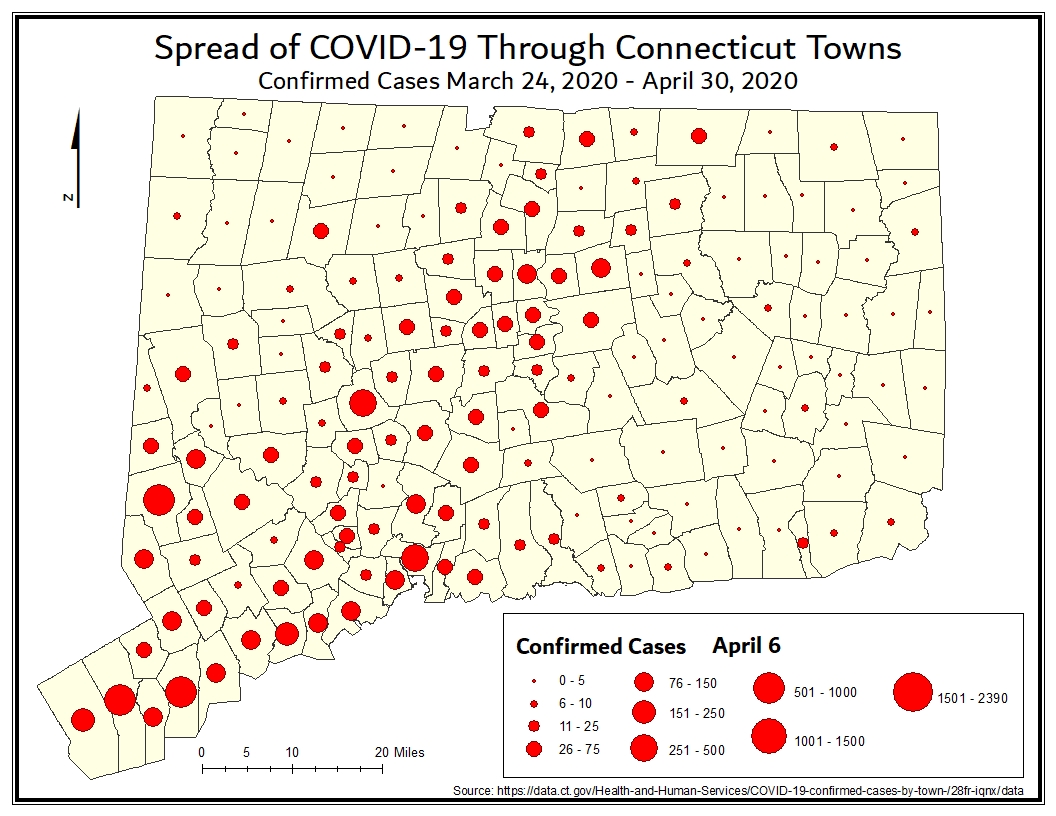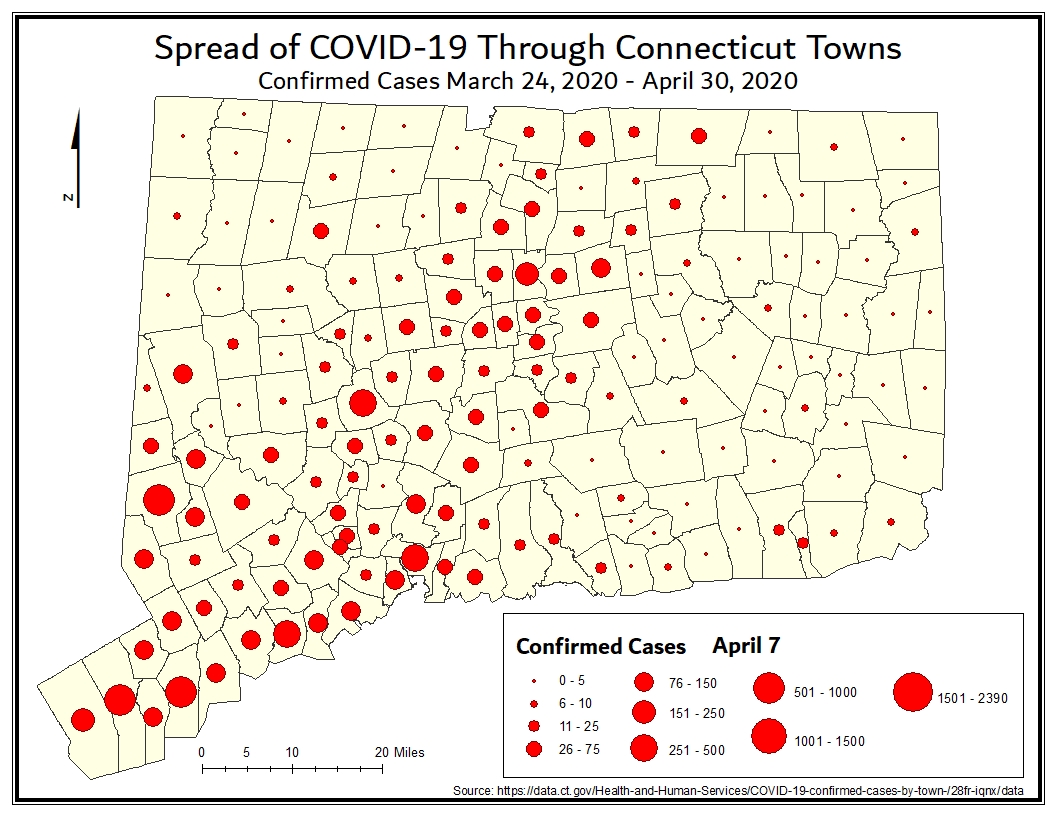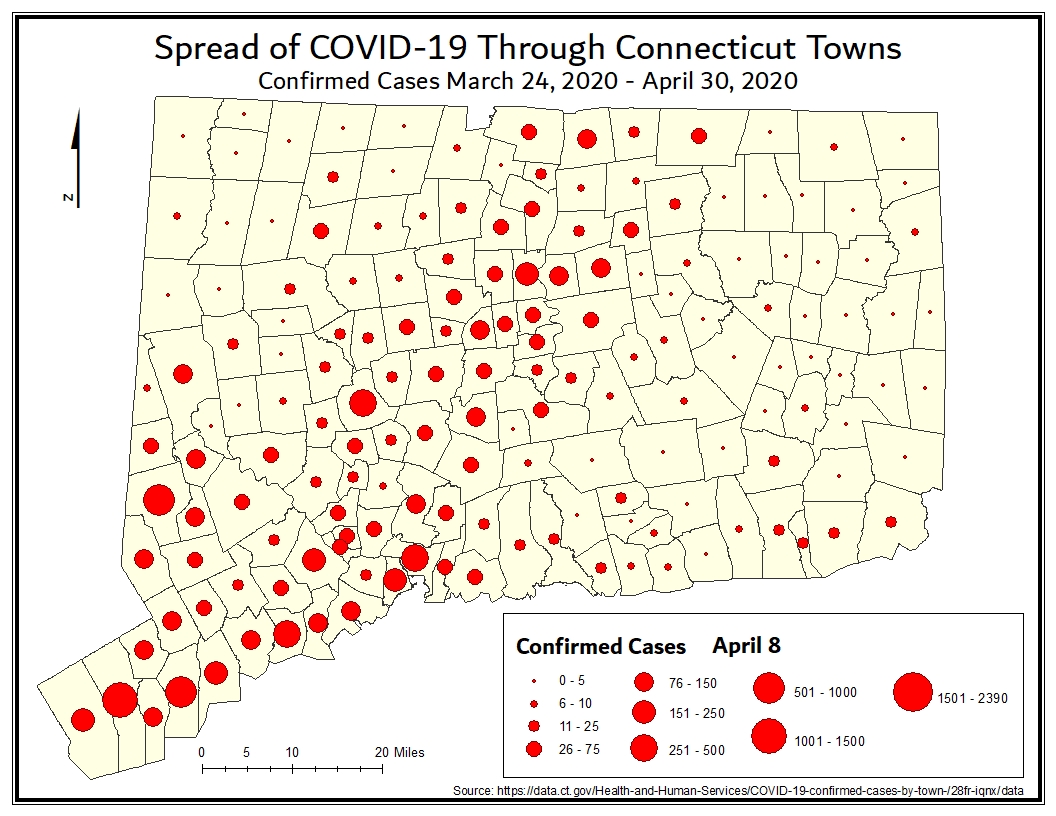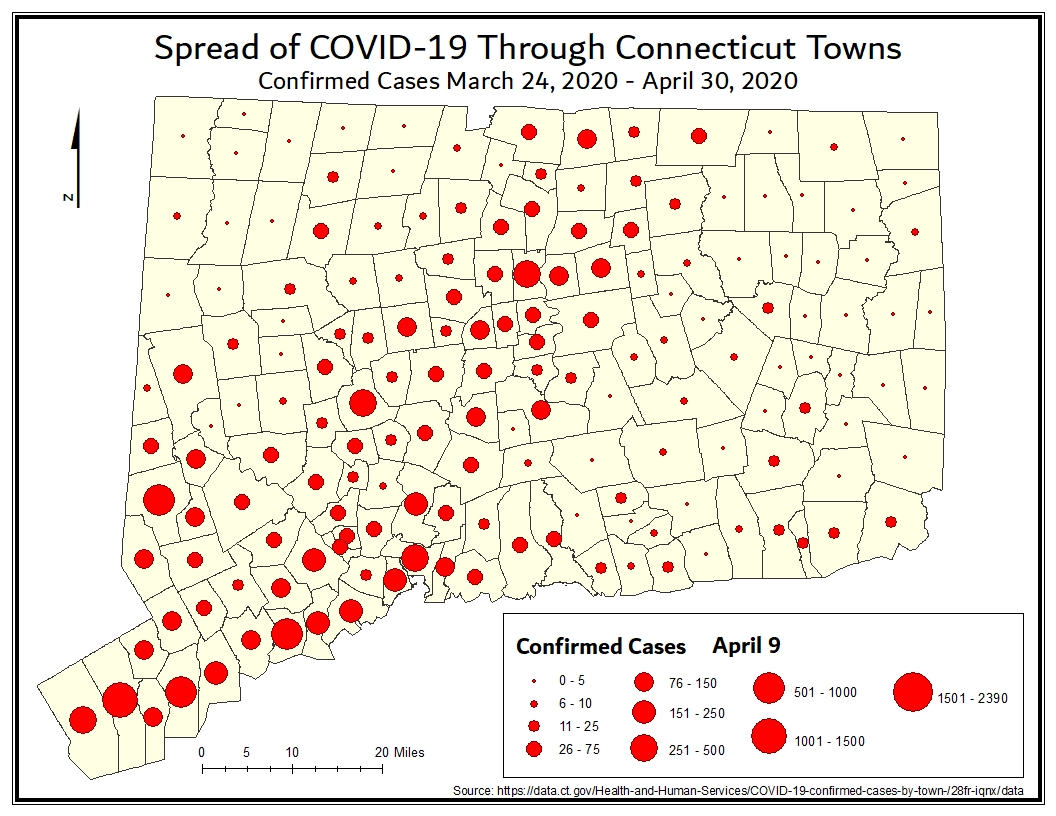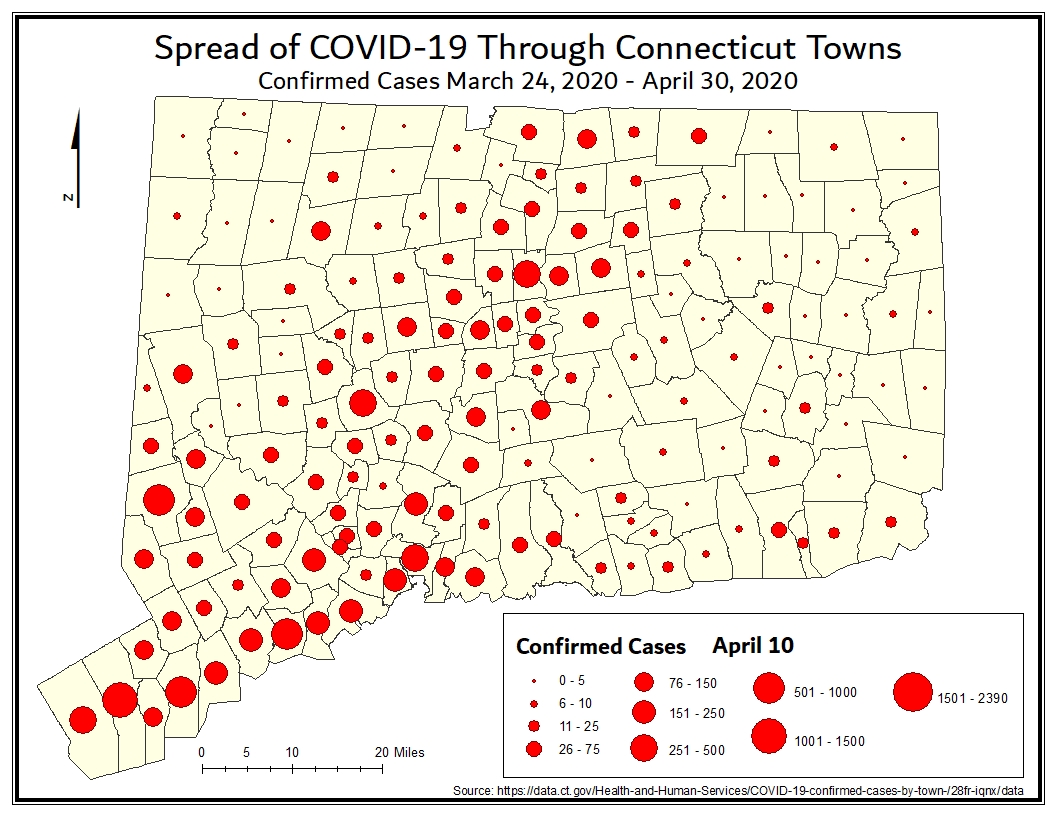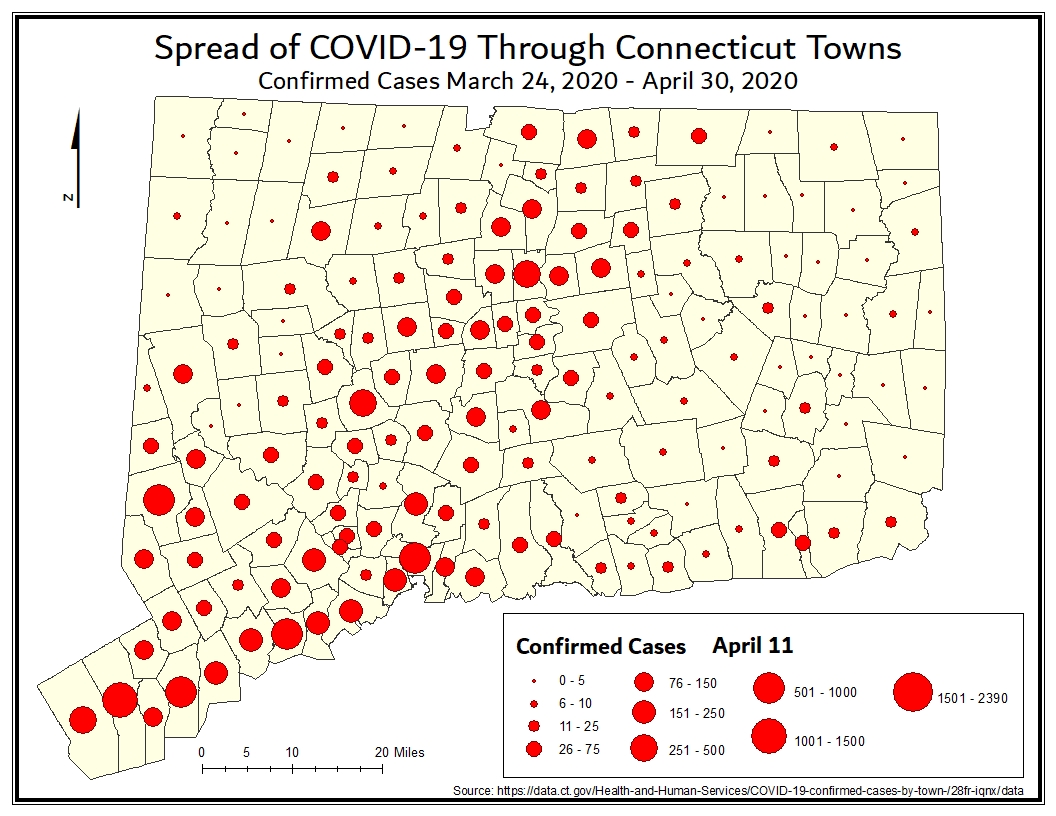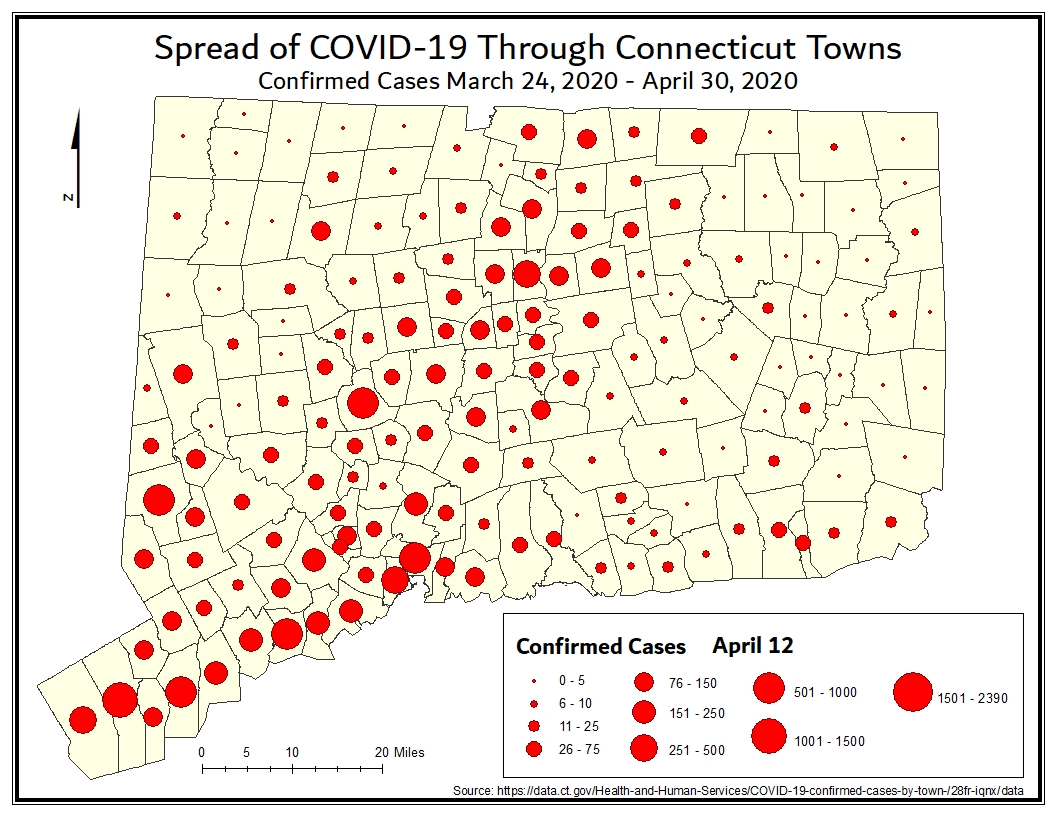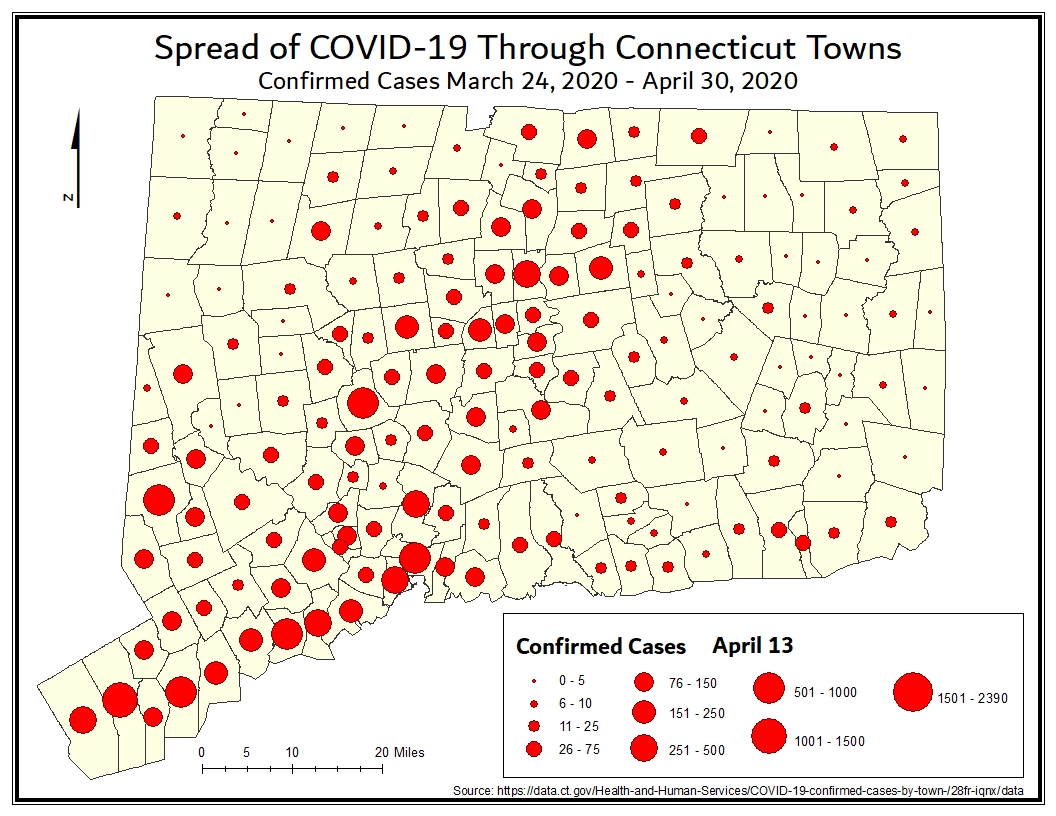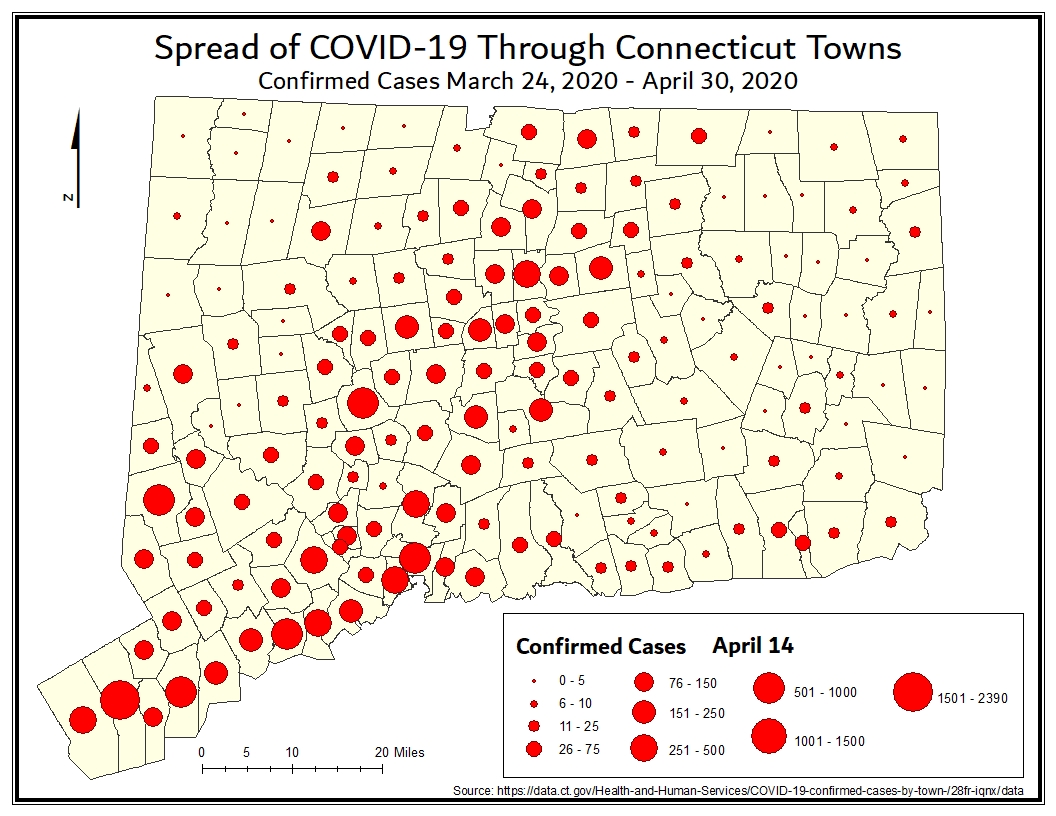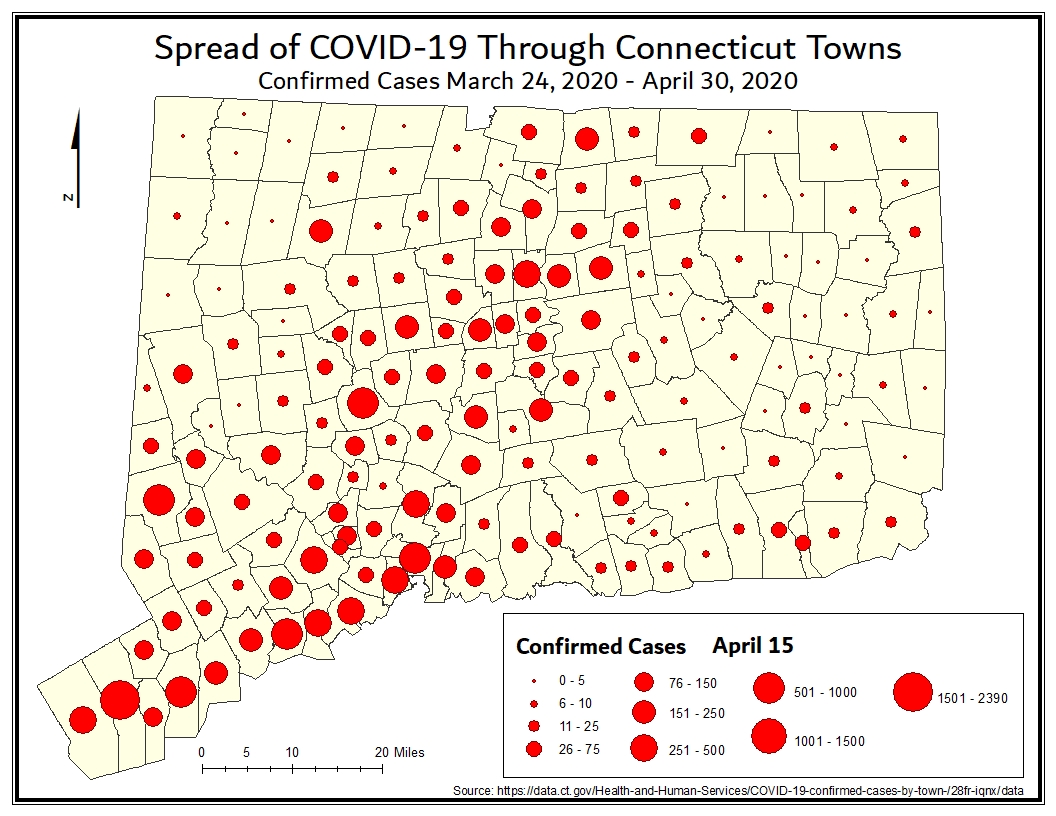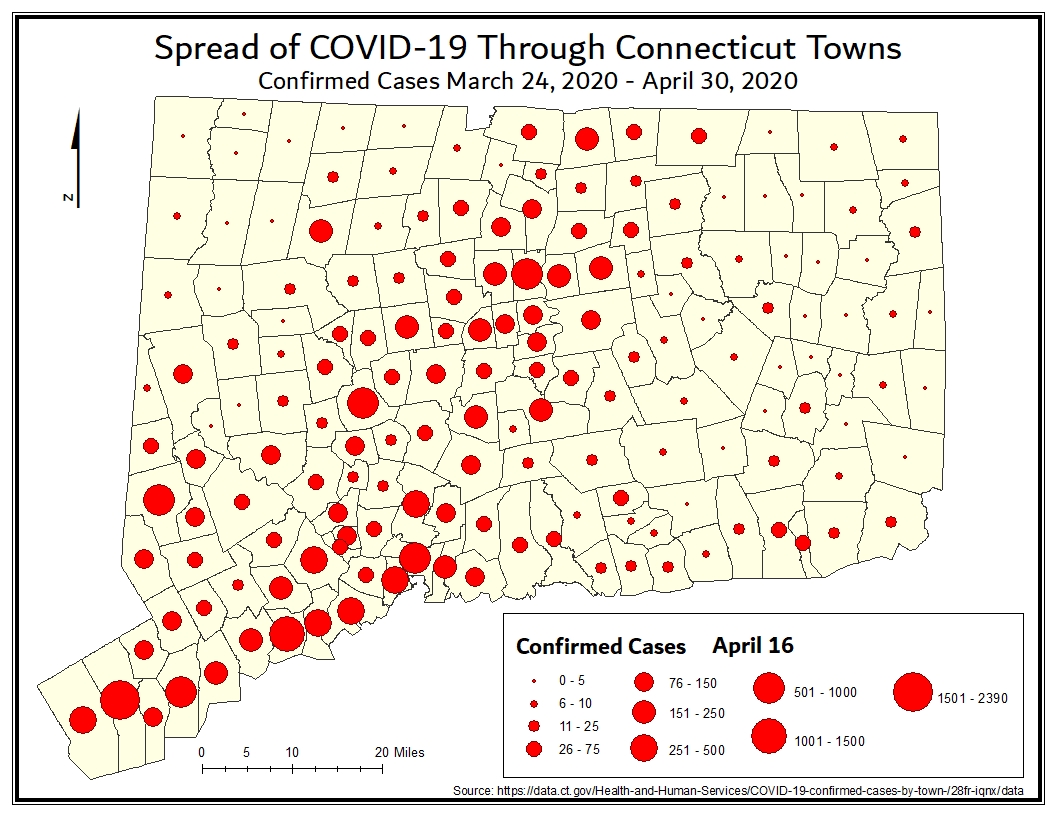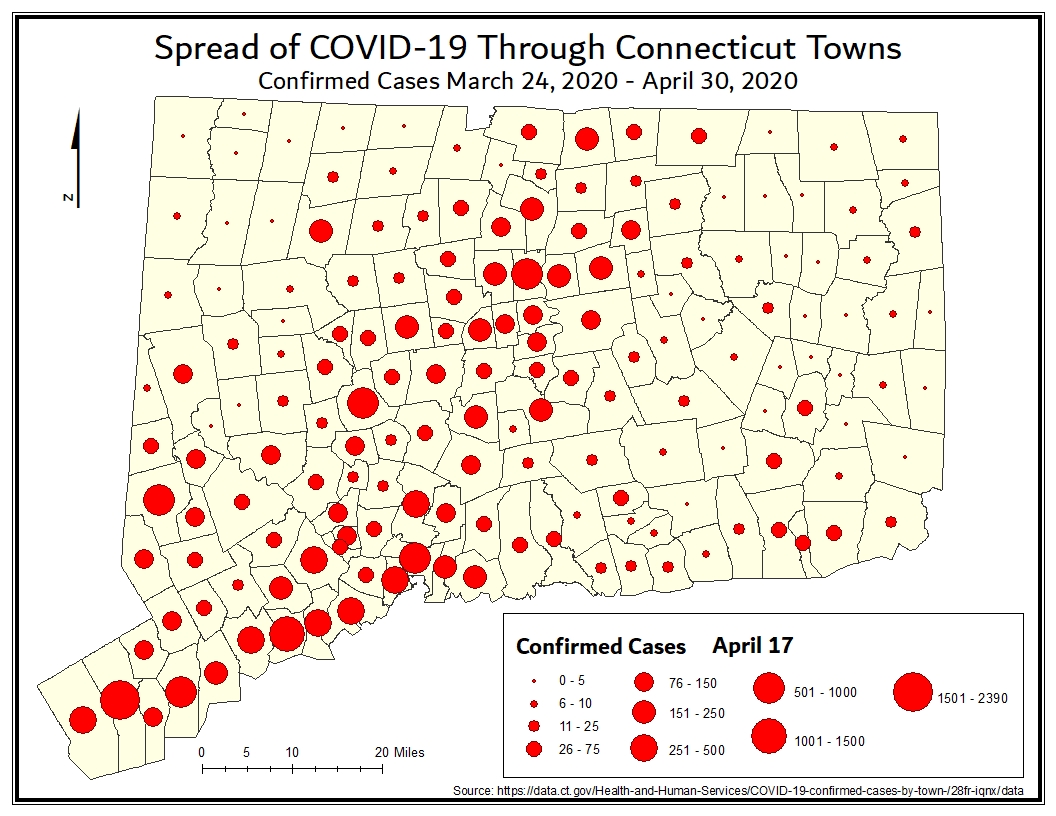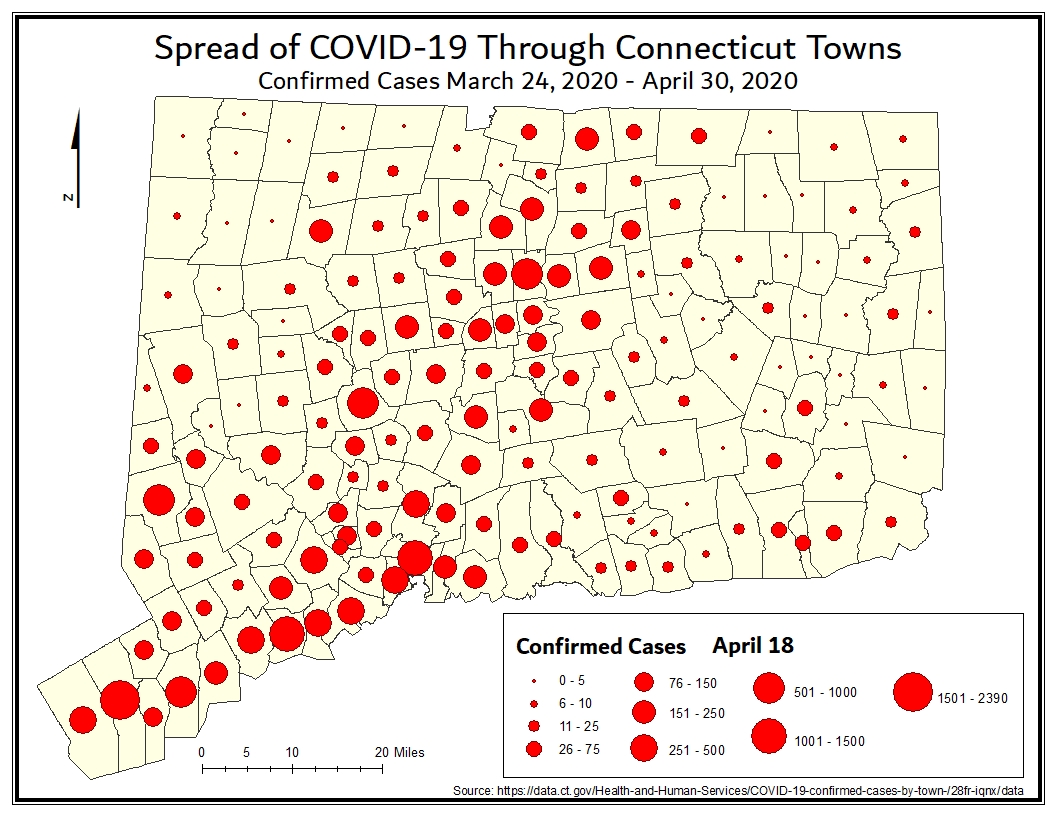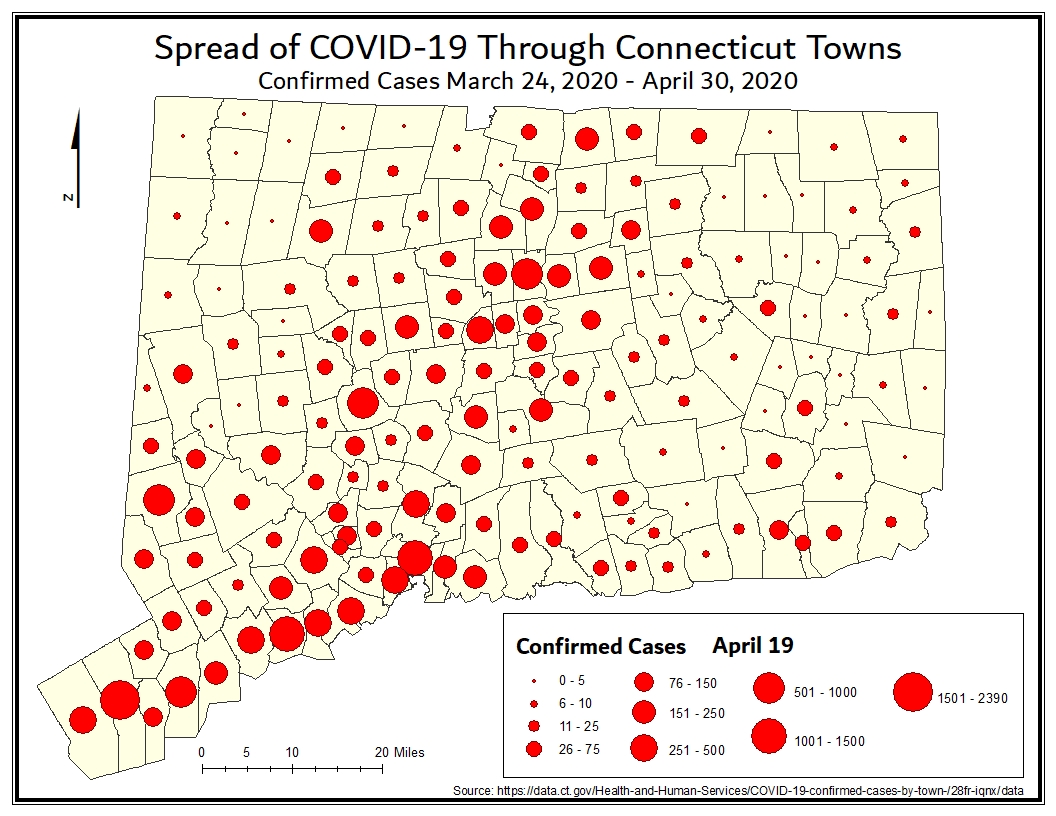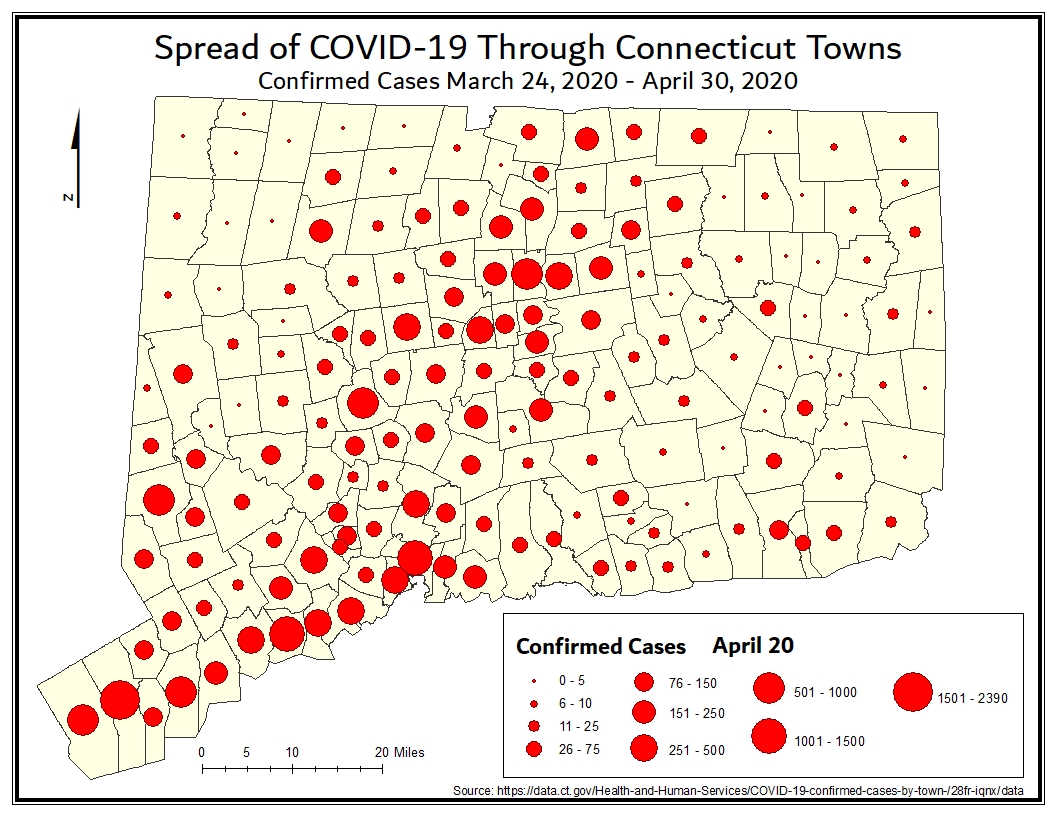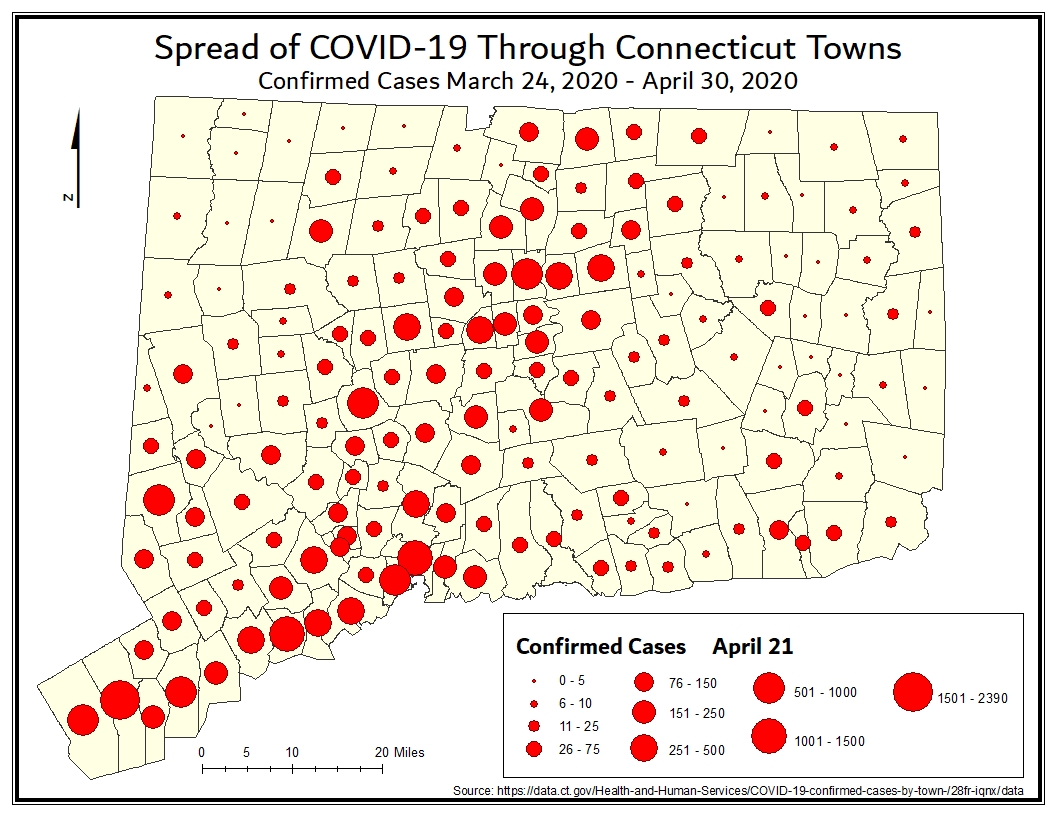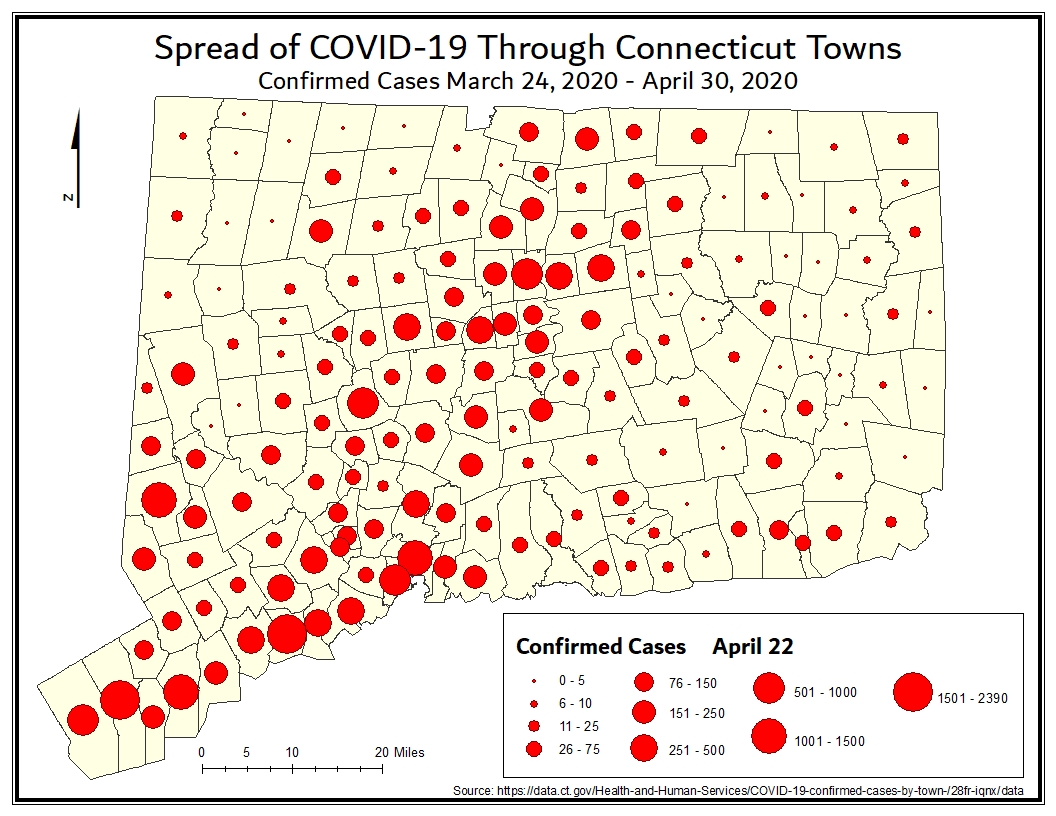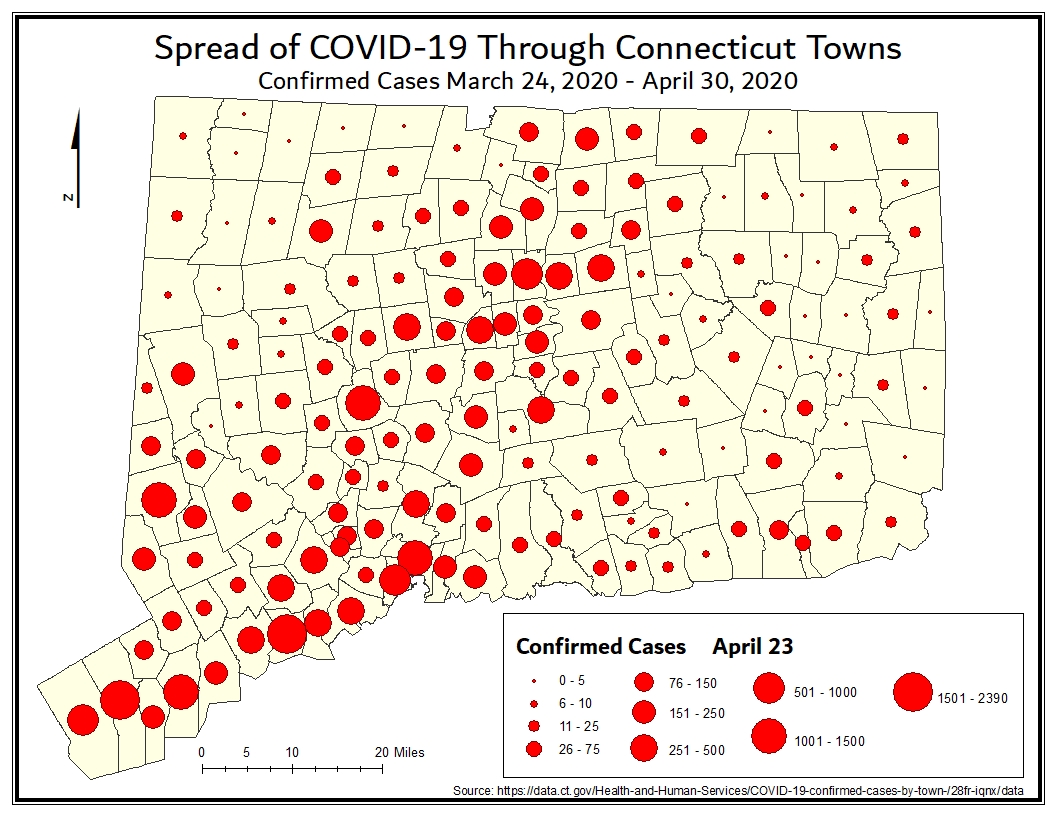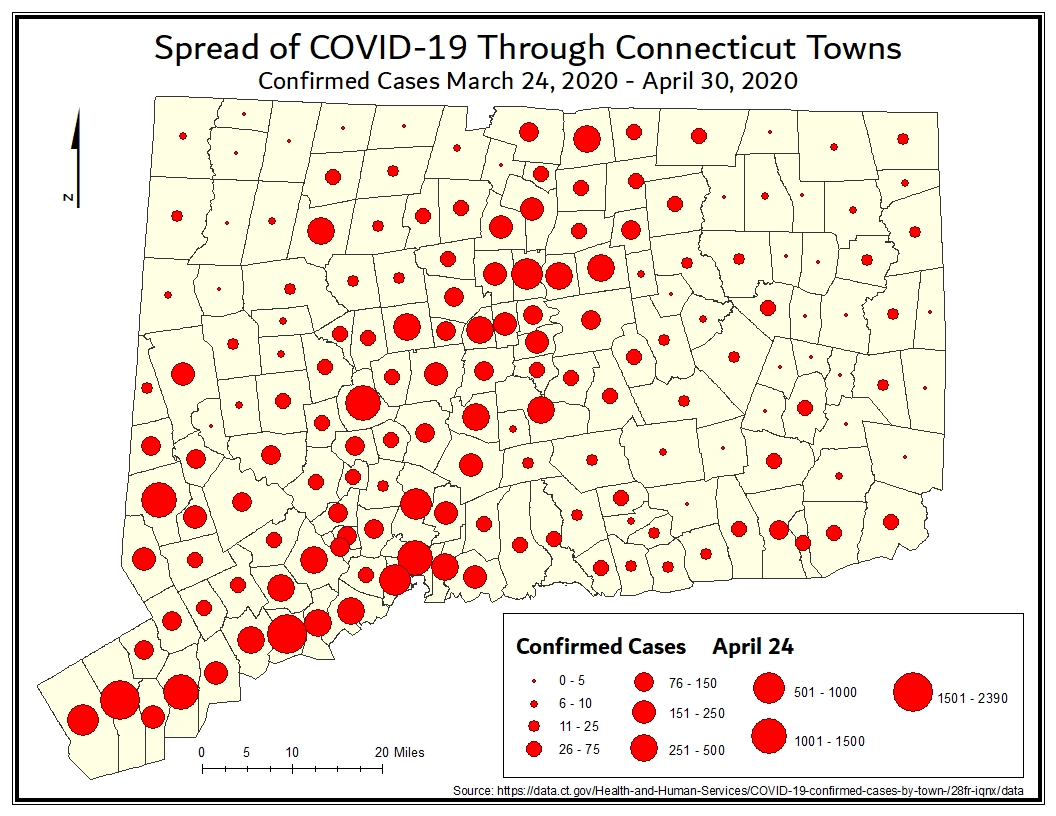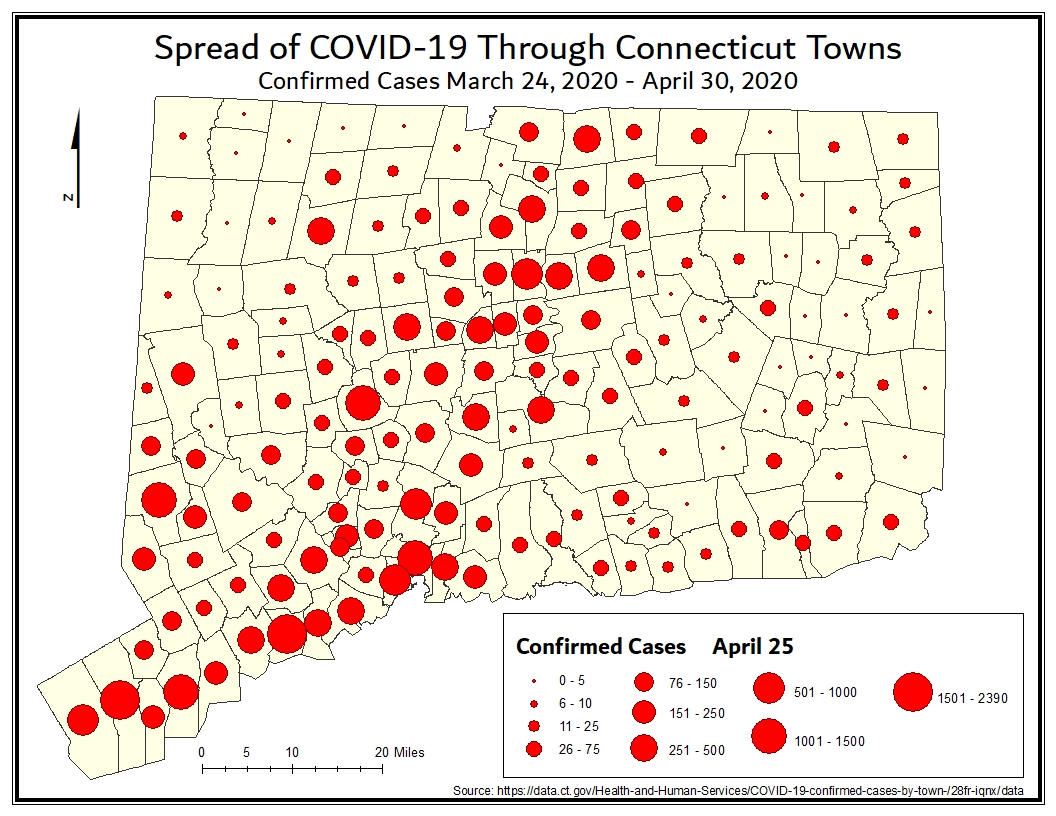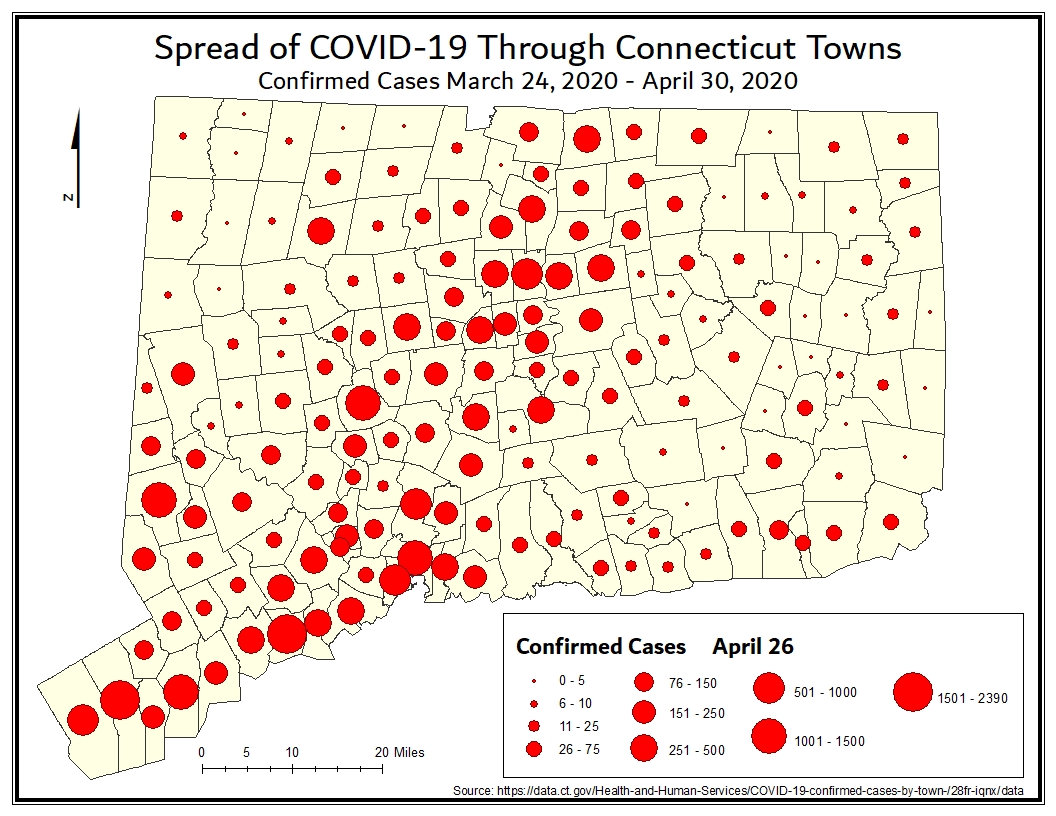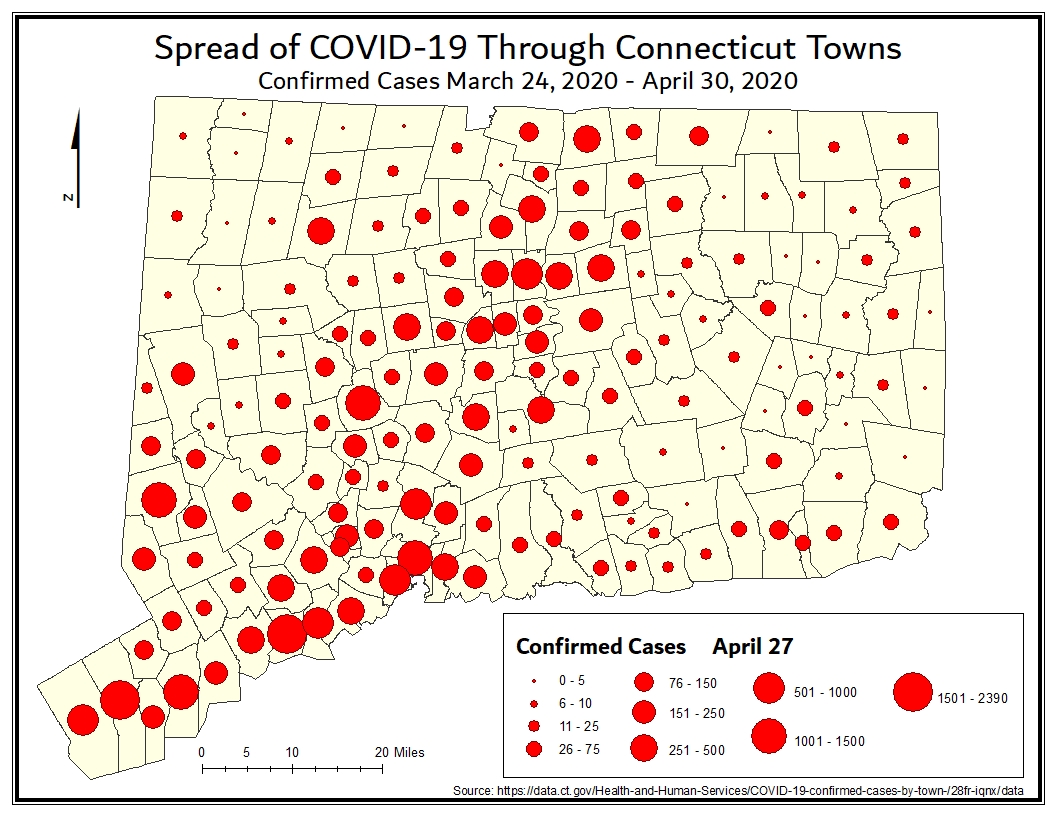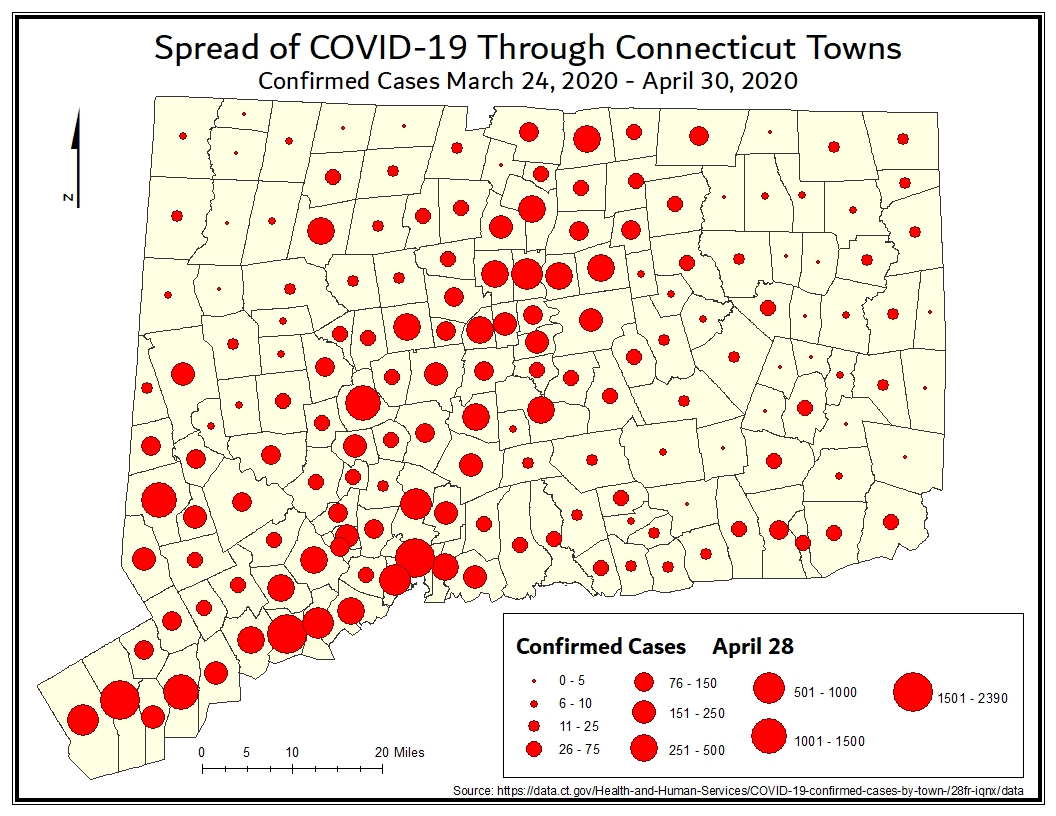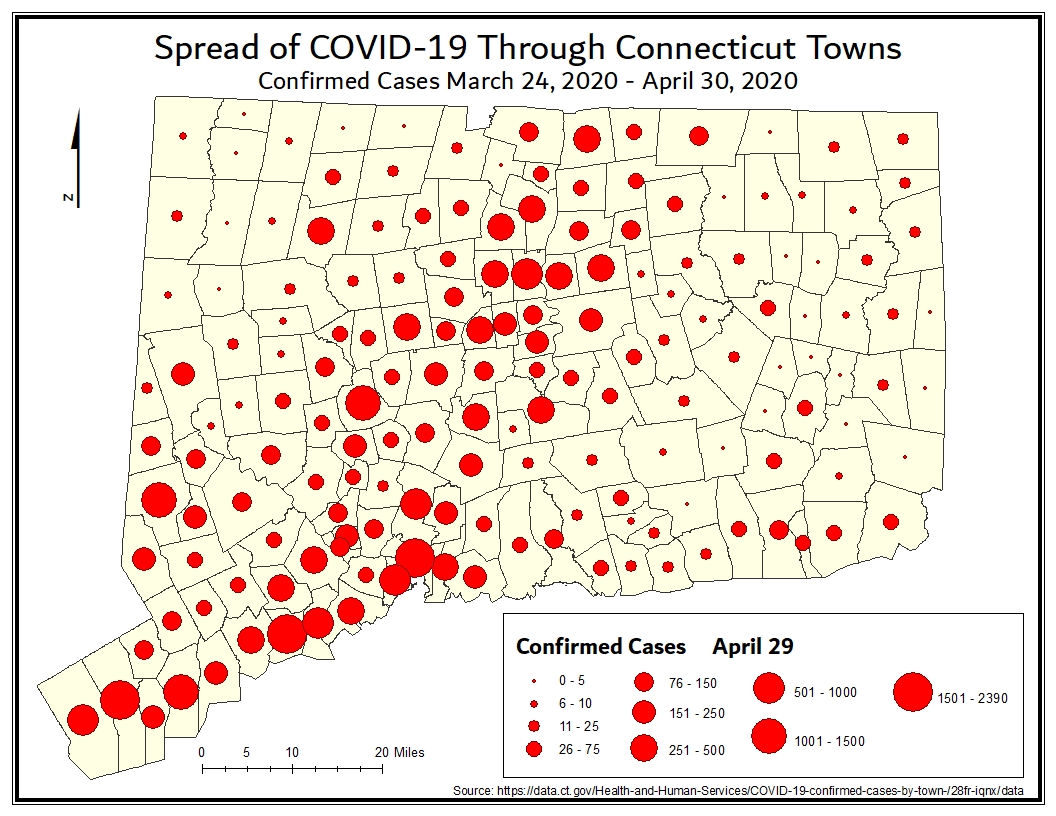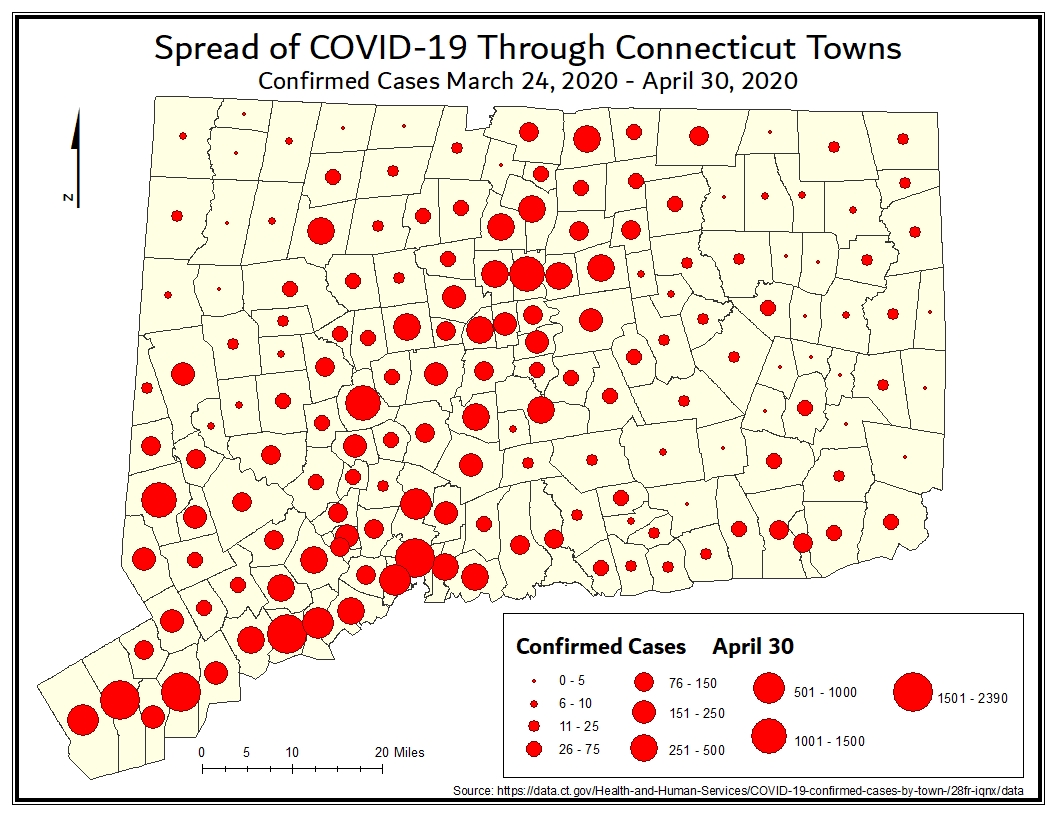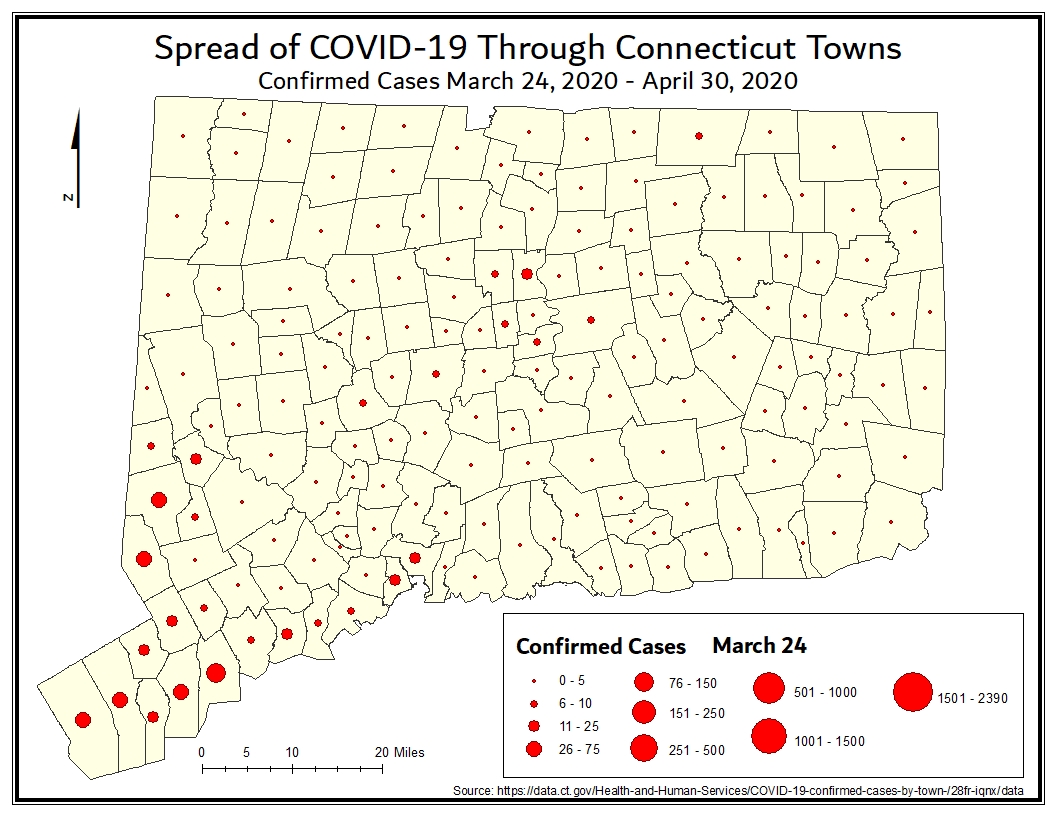
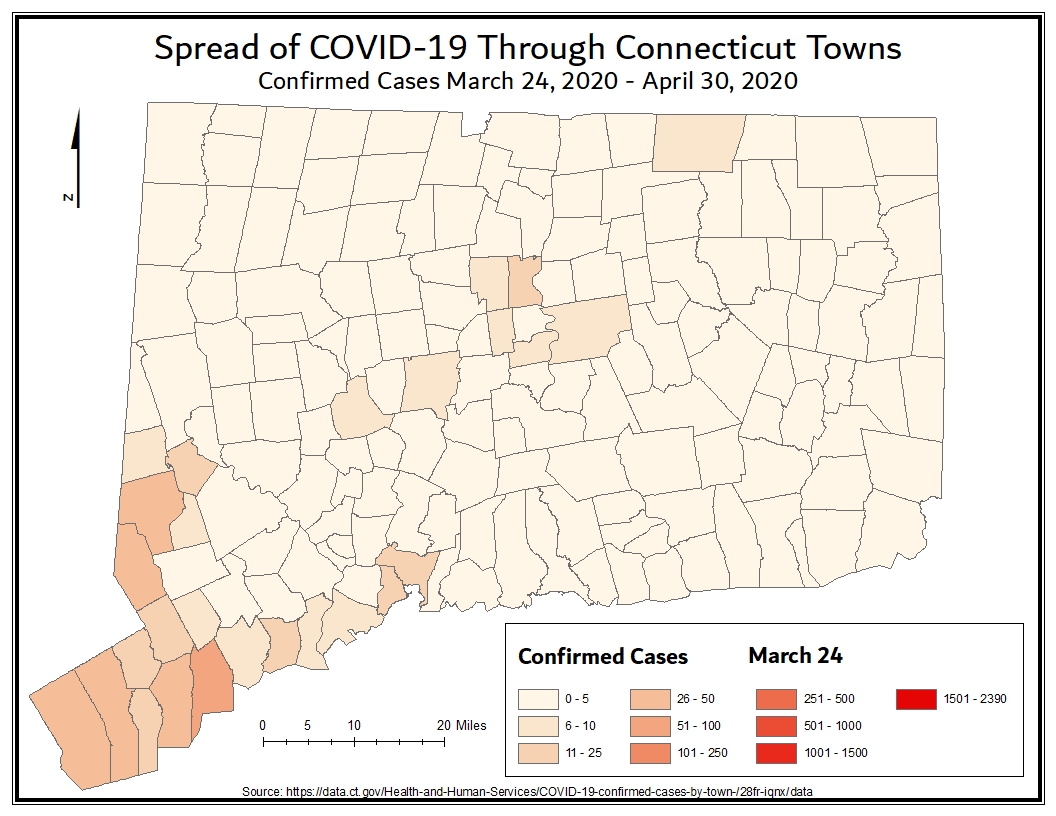
Click either of the maps below to see an animated map of the spread of COVID-19 cases through Connecticut from March 24, 2020 through April 30, 2020. The information is the same in each map, only the way it is displayed differs.
For reference, a static map with Connecticut town names is included with each animated map.
| Or click on a date below to see the confirmed cases for that day. | ||||||||
| 3-24-2020 | 3-25-2020 | 3-26-2020 | 3-27-2020 | 3-28-2020 | 3-29-2020 | 3-30-2020 | 3-31-2020 | 4-01-2020 |
| 4-02-2020 | 4-03-2020 | 4-04-2020 | 4-05-2020 | 4-06-2020 | 4-07-2020 | 4-08-2020 | 4-09-2020 | 4-10-2020 |
| 4-11-2020 | 4-12-2020 | 4-13-2020 | 4-14-2020 | 4-15-2020 | 4-16-2020 | 4-17-2020 | 4-18-2020 | 4-19-2020 |
| 4-20-2020 | 4-21-2020 | 4-22-2020 | 4-23-2020 | 4-24-2020 | 4-25-2020 | 4-26-2020 | 4-27-2020 | 4-28-2020 |
| 4-29-2020 | 4-30-2020 | |||||||